Research
Statistics has evolved to address complex research questions that often require integrating multiple data sources. This evolution places greater demands on data preparation, exploration, and visualization prior to confirmatory analysis. Modern data analysis also drives the development of statistical software that capable of supporting fast, yet comprehensive, exploratory tasks across diverse data types, including spatial, temporal, imageries, and text data. My research focuses on two main areas:
- developing methods and software tools for exploring and visualizing multivariate and spatio-temporal data, and
- building the theoretical foundations for constructing general-purpose tools for practical data analysis.
An LLM-based pipeline for understanding decision choices in data analysis from published literature
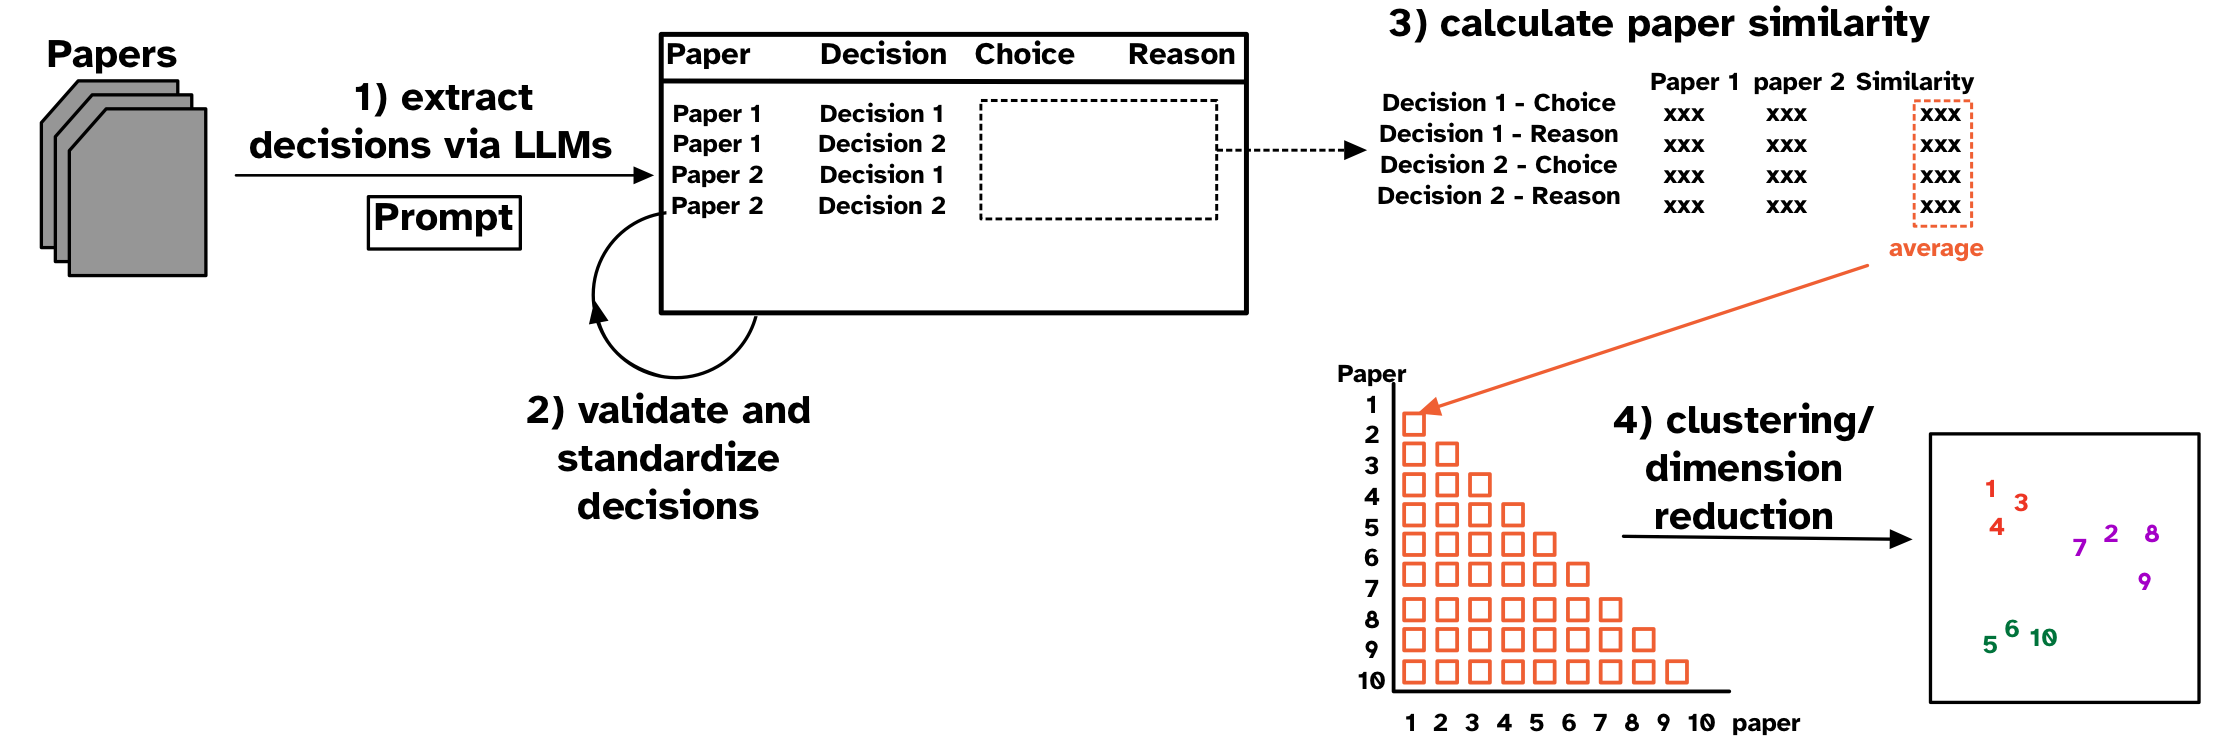
Decision choices, such as those made when building regression models, and their rationale are essential for interpreting results and understanding uncertainty in data analysis. However, these decisions are rarely studied because tracing every alternatives considered by authors is often impractical. Researchers often manually review large bodies of published analyses to identify common choices and understand how these choices are made. In this work, I propose a workflow to automatically extract analytic decisions and their reasons from published literature using Large Language Models. I also introduce a paper similarity measure based on decision similarity and visualization methods using clustering algorithms. This workflow is applied to understand decision choices in the association of daily particulate matter and daily mortality in air pollution modeling literature. This approach enables scalable and automated studies of decision choices in applied data analysis given the recent advnace of LLMs, providing an alternative to existing qualitative and interview-based studies. This work is currently under review for 2026 CHI Conference on Human Factors in Computing Systems.
A tidy framework and infrastructure to systematically assemble spatio-temporal indexes from multivariate data
Indexes are useful for summarizing multivariate information into a single metric for monitoring, communicating, and decision-making. While most work has focused on defining new indexes for specific purposes, most indexes are not designed and implemented in a way that makes it easy to understand index behavior in different data conditions, and to determine how their structure affects their values and variation in values. I developed a modular data pipeline recommendation to assemble indexes, and it allows investigation of index behavior as part of the development procedure. One can compute indexes with different parameter choices, adjust steps in the index definition by adding, removing, and swapping them to experiment with various index designs, calculate uncertainty measures, and assess indexes’ robustness. Figure 1 shows the Global Gender Gap Index, comprised of four dimensions (economy, education, health, and politics) in a linear combination with equal weights of 0.25. The tour animation shows how the index value and country ranking changes as the weight assigned to the politics dimension changes. This work has been published in Journal of Computational and Graphical Statistics.
cubble: An R Package for Organizing and Wrangling Multivariate Spatio-temporal Data
For many analyses, spatial and time components can be separately studied: for example, to explore the temporal trend of one variable for a single spatial location, or to model the spatial distribution of one variable at a given time. However for others, it is important to analyze different aspects of the spatio-temporal data simultaneously, for instance, temporal trends of multiple variables across locations. In order to facilitate the study of different portions or combinations of spatio-temporal data, we introduce a new class, cubble, with a suite of functions enabling easy slicing and dicing on different spatio-temporal components. Figure 2 is created by analyzing the daily maximum temperature data form Global Historical Climatology Network (GHCN) across stations in two Australia states, using the cubble data structure and the glyph maps are created using the geom_glyph() function, also implemented in the cubble package, as follows:
tmax |>
  ggplot(aes(x_major = long, x_minor = month, y_major = lat, y_minor = tmax, ...)) +
  geom_sf(..., inherit.aes = FALSE) +
  geom_glyph_box(...) +
  geom_glyph(...) +
  ...
This work has been accepted by Journal of Statistical Software and won the ASA John M. Chambers Statistical Software Award.
Visual Diagnostics for Constrained Optimisation with Application to Guided Tours
Projection pursuit is a technique used to find interesting low-dimensional linear projections of high dimension data by optimizing an index function on projection matrices. The index function could be non-linear, computationally expensive to calculate the gradient, and may have local optima, which are also interesting for projection pursuit to explore. This work has designed four diagnostic plots to visualize the optimisation routine in projection pursuit, and Figure 3 is one of them, plotting two optimisation paths in a 5D unit sphere space. This work has been published in the R Journal.